How x-ray diffraction with synchrotron radiation got started
The need to record low angle scattering x-ray fibre diagrams from muscle with milli-second time resolution drove the use of synchrotron radiation as an x-ray light source. The first smudgy diffraction patterns were obtained from a slice of insect flight muscle. Out of this grew the EMBL Outstation at DESY.
Figures
The Lymn-Taylor cycle
![Fig 1: The Lymn-Taylor cycle (Lymn & Taylor, 1971) . A diagrammatic representation of the crossbridge cycle: the myosin cross bridge is bound to actin in rigor 45°- position - "down" (1) ATP binds which leads to very fast dissociation from actin (2)]. The hydrolysis of ATP to ADP and a phosphate ion leads to a return of the myosin cross bridge to the 90° "up" position(3) whereupon it rebinds to actin (4). This leads to release of the products and return to [1]. In the last step actin is "rowed" past myosin.](/26969/original-1309858144.webp?t=eyJ3aWR0aCI6OTYwLCJmaWxlX2V4dGVuc2lvbiI6IndlYnAiLCJvYmpfaWQiOjI2OTY5fQ%3D%3D--4f2f3a7e2bbdbcc7ca4e55cfba99db0091995c02 "[\"\"]")
![Fig 1: The Lymn-Taylor cycle (Lymn & Taylor, 1971) . A diagrammatic representation of the crossbridge cycle: the myosin cross bridge is bound to actin in rigor 45°- position - "down" (1) ATP binds which leads to very fast dissociation from actin (2)]. The hydrolysis of ATP to ADP and a phosphate ion leads to a return of the myosin cross bridge to the 90° "up" position(3) whereupon it rebinds to actin (4). This leads to release of the products and return to [1]. In the last step actin is "rowed" past myosin.](/26969/original-1309858144.jpg?t=eyJ3aWR0aCI6MjQ2LCJvYmpfaWQiOjI2OTY5fQ%3D%3D--5cd200d49d29f3fe22d2154e929a900db9af2eca)
© Kenneth C. Holmes
Fig 1: The Lymn-Taylor cycle (Lymn & Taylor, 1971) . A diagrammatic representation of the crossbridge cycle: the myosin cross bridge is bound to actin in rigor 45°- position - "down" (1) ATP binds which leads to very fast dissociation from actin (2)]. The hydrolysis of ATP to ADP and a phosphate ion leads to a return of the myosin cross bridge to the 90° "up" position(3) whereupon it rebinds to actin (4). This leads to release of the products and return to [1]. In the last step actin is "rowed" past myosin.
© Kenneth C. Holmes
The Lymn-Taylor cycle (Lymn & Taylor, 1971). A diagrammatic representation of the crossbridge cycle: the myosin cross bridge is bound to actin in rigor 45°- position - "down" (1) ATP binds which leads to very fast dissociation from actin (2)]. The hydrolysis of ATP to ADP and a phosphate ion leads to a return of the myosin cross bridge to the 90° "up" position (3) whereupon it rebinds to actin (4). This leads to release of the products and return to [1]. In the last step actin is "rowed" past myosin.
X-ray fibre diffraction pattern
. The fibre axis is at right angles to the x-ray beam. Note the regular layer lines (with a repeat of (1/430Å) which arise from the helical array of myosin cross bridges. The third order (1/143.5Å) meridional reflexion corresponds to the repeat distance between cross-bridges. (This x-ray fibre diagram was obtained using a rotating anode x-ray generator and mirror-monochromator optics).")

Fig 2: X-ray fibre diffraction pattern of a living frog muscle (Huxley & Brown, 1967). The fibre axis is at right angles to the x-ray beam. Note the regular layer lines (with a repeat of (1/430Å) which arise from the helical array of myosin cross bridges. The third order (1/143.5Å) meridional reflexion corresponds to the repeat distance between cross-bridges. (This x-ray fibre diagram was obtained using a rotating anode x-ray generator and mirror-monochromator optics).
X-ray fibre diffraction pattern of a living frog muscle (Huxley & Brown, 1967). The fibre axis is at right angles to the x-ray beam. Note the regular layer lines (with a repeat of (1/430Å) which arise from the helical array of myosin cross bridges. The third order (1/143.5Å) meridional reflexion corresponds to the repeat distance between cross-bridges. (This x-ray fibre diagram was obtained using a rotating anode x-ray generator and mirror-monochromator optics).
Only the distal part of the cross bridge moves

© Kenneth C. Holmes
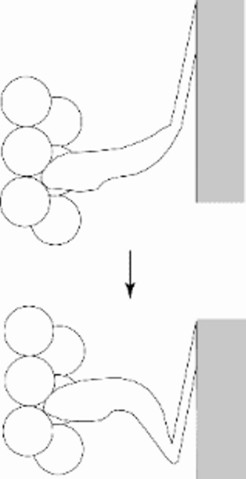
Fig 6: Numerous experiments (mostly negative) indicated that the scheme shown in Fig 1 needed revision: only the distal part of the cross bridge moves (Cooke 1986).
© Kenneth C. Holmes
Numerous experiments indicated that the scheme shown in Fig 1 needed revision: only the distal part of the cross bridge moves (Cooke, 1986).
The structure of the actin myosin complex
 : shown are (right) five actin molecules in an actin helix (Holmes et al. 1990) and (left) a myosin cross-bridge (S1)(Rayment et al. 1993): shown are: 25K fragment (green); 50K upper fragment (red); 50K lower fragment (white); the disordered chain between the 50K domain and the 20K domain is shown as a yellow loop - note this loop has been modeled; the first part of the 20K domain including the SH2 helix (until 699) is shown light blue; the SH1 helix, converter domain and the C-terminal helix - \"the neck\" (dark blue): the regulatory light chain (magenta) and the essential light chain (yellow). Plates prepared with GRASP (Nicholls et al. 1991). This is the \"end\" state.")

Fig 7a: The structure of the actin myosin complex (Rayment et al. 1993; Schroeder et al. 1993) : shown are (right) five actin molecules in an actin helix (Holmes et al. 1990) and (left) a myosin cross-bridge (S1)(Rayment et al. 1993): shown are: 25K fragment (green); 50K upper fragment (red); 50K lower fragment (white); the disordered chain between the 50K domain and the 20K domain is shown as a yellow loop - note this loop has been modeled; the first part of the 20K domain including the SH2 helix (until 699) is shown light blue; the SH1 helix, converter domain and the C-terminal helix - "the neck" (dark blue): the regulatory light chain (magenta) and the essential light chain (yellow). Plates prepared with GRASP (Nicholls et al. 1991). This is the "end" state.
The structure of the actin myosin complex (Rayment et al. 1993; Schroeder et al. 1993) : shown are (right) five actin molecules in an actin helix (Holmes et al. 1990) and (left) a myosin cross-bridge (S1)(Rayment et al. 1993): shown are: 25K fragment (green); 50K upper fragment (red); 50K lower fragment (white); the disordered chain between the 50K domain and the 20K domain is shown as a yellow loop - note this loop has been modeled; the first part of the 20K domain including the SH2 helix (until 699) is shown light blue; the SH1 helix, converter domain and the C-terminal helix - "the neck" (dark blue): the regulatory light chain (magenta) and the essential light chain (yellow). Plates prepared with GRASP (Nicholls et al. 1991). This is the "end" state.
A reconstruction of the beginning state
. The missing \"neck\" or lever arm has been modeled from chicken S1 data. Note the 70° rotation of the lever arm. The rotation of the lever arm is controlled by the bending out of a helix (shown white) which contacts the g-phosphate at its inner end (the so called\"switch-2\" region). The distal end of the lever arm moves about 12nm between the two states.")

Fig 7b: A reconstruction of the "beginning" state from the crystallographic data on the dictyostelium construct truncated at 761 and complexed with ADP.vanadate (Smith and Rayment 1996). The missing "neck" or lever arm has been modeled from chicken S1 data. Note the 70° rotation of the lever arm. The rotation of the lever arm is controlled by the bending out of a helix (shown white) which contacts the g-phosphate at its inner end (the so called"switch-2" region). The distal end of the lever arm moves about 12nm between the two states.
A reconstruction of the "beginning" state from the crystallographic data on the dictyostelium construct truncated at 761 and complexed with ADP.vanadate (Smith and Rayment 1996). The missing "neck" or lever arm has been modeled from chicken S1 data. Note the 70° rotation of the lever arm. The rotation of the lever arm is controlled by the bending out of a helix (shown white) which contacts the g-phosphate at its inner end (the so called"switch-2" region). The distal end of the lever arm moves about 12nm between the two states.